Art Mapping Venice Abstract

1. Introduction

The coming of digital era brings us new tools to come up with solutions for humanities problems. These tools in general make the solution a lot easier. This is the case for the geographical information systems. Geographical information systems are the tools that enables to capture and make use of geographical data for different purposes. These tools make dealing with geographical data a lot easier. For example, Jacopo de’ Barbari, an Italian painter, mapped the city of Venice in great detail in late 14th century. This should have taken a lot of effort at that time to map a city in great detail. However, if he lived in this age, the same task for him would be a lot more easier to realize with the help of digital tools.

Geographical information systems opens up new areas of research one of which is art mapping.  Art mapping is to represent an artwork by making use of associated geographical information of the artwork on a map. This way the user can easily associate the spatial information with the artwork. For example, Art Mapping Venice project realized by Orhan Öçal and Tania Palmieri represents the city of Venice by its art works. Since my project is to extend Art Mapping Venice project, it would be a good idea to briefly explain this project.

The purpose of the Art Mapping Venice project is to map the city of Venice through art works such as paintings, photos, drawings. In order to do this, they created a user friendly web-page where you can see the current city map with aerial shades on top of the historically or artistically important places which they call as point of interest. The user can browse through the map, zoom in and out. This map is just like what we see on Google Maps since they have used Google Maps interface and some of its functionalities while realizing the project. When the user clicks on those areal shades, they are provided with a small pop-up window where the user can see the artwork associated with the place. Moreover, when the user clicks on information button he/she is provided with more information about the place, paintings together with contemporary photographs of that place.

old projectArt Mapping Venice Web Tool

2. Research Question

The research question I would like to solve is to extend this web tool by adding the functionality that user can switch between an historical map of Venice and current map of Venice. In the current version of the project, old representation of a specific point is shown on a small pop-up window. It would be a good extension to show the old representation as a whole map or some part of the map with the same orientation . This way user can see the differences between the two maps and see the changes over the course of history.

In order to realize this project, first question would be to find an old map of Venice that has a good quality and is easy to match with the current map of the Venice. For that matter, Jacopo de’ Barbari’s map of Venice published around 1500 is used. This map not only has a good quality but also covers the area that we are interested in. The next question would be about identifying point of interests on the old map and matching them with the current map. Moreover, when the user switches between the old map and current map, the orientation of the maps should match so that user can compare the old map and current map easily. Another challenge is about representing the old map on a geographical information system. It would be a good idea to continue with Google Maps interface since the existing project uses it. For that reason, how to represent an image on Google Maps interface is also a part of the research.

In brief, the goal is to add user-friendly functionality that user can switch between an historical map of Venice by Jacopo de’ Barbari and current map of Venice to the Art Mapping Venice project. Achieving this goal requires going through the following research phases:

– Identification and representation of point of interest locations on the Jacopo de’ Barbari’s map

– Representing Jacopo de’ Barbari’s map on Google Maps

– Transition between Jacopo de’ Barbari’s map and current map of Venice

3. Identification and representation of point of interest locations on the Jacopo de’ Barbari’s map

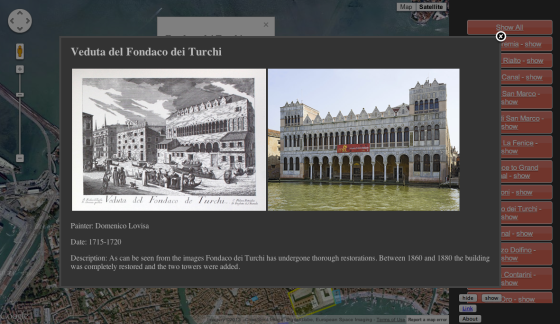
In order to realize the project, it is necessary to identify the point of interest locations on the Barbari’s map. Those places are basically historically important places of the city of Venice. For that reason, it is likely that those places are also covered in Barbari’s map. There are 20 point of interest locations on the existing project. After doing some research, it turned out that 14 of those places are also covered in the Barbari’s map.  These places are San Geremia, Ponte di Rialto, Grande Canal,  San Giorgio Maggiore, Piazza San Marco, Scuola di San Marco, Entrance to Grand Canal, Prigioni, Fondaco dei Turchi, Arsenal, Palais Contarini, Ca d’Oro,  Santa Maria Gloriosa dei Frari, Palazzo del Michiel.  The only thing to note here is that Fondaco dei Turchi does not look the same since it has undergone thorough restorations between 1860 and 1880. 6 remaining places were not identified because of the following reasons. Osteria dei Sabbioni, Villa Foscari are outside the area where Barbari’s map covers. Santa Maria della Salute (built in 1687), Teatro La Fenice (built in 1792),  Palazzo Dolfino (built in 1536), Église du Rédempteur (built in 1592) are built after Barbari draw the map.

In the existing project, point of interest locations are represented by polygon drawings. This is done by preparing a KML database to store the information and process it to show the drawings. Similar approach is adopted for the Barbari’s map also. In order to show the polygon drawings on top of point of interest locations, KML database corresponding to point of interests on the Barbari’s map was prepared. The coordinates of the corners for each of the point of interest is found out and written to the KML database. Since for the KML database everything will be the same as the existing database except for the coordinates, the same KML database is used and only the coordinate values are changed.

piazzasanmarcoPiazza San Marco on Jacopo de’ Barbari’s Map with Polygon Drawing on Top

4. Representing Jacopo de’ Barbari’s map on Google Maps

In order to show the Barbari’s map on Google Maps, two possibilities were found out. One possibility is to use define a different map type for the corresponding image by using image map types documentation of Google Maps API. Second possibility is to use adding a custom overlay example on Google Maps API documentation.

In order to explain the first approach, it is necessary to explain the tile concept on Google Maps. While Google Maps is loading, instead of loading the whole map, it actually loads square small parts of the map in order to make the processing faster. These small parts are called tiles. For defining the image map type, the idea is to provide an image source for each tile. For that matter, it is necessary to break the Barbari’s map image into pieces beforehand so that we can provide image source file for each tile. Also, note here that these images change for different zoom levels. Therefore, we need to break the Barbari’s image into pieces for each zoom level and store them. This approach is inefficient in terms of storage. Moreover, this approach brings difficulties in terms of implementation.

tilesGoogle Maps Tiles

In adding a custom overlay example, you specify the coordinates of the corner points where the image is put. Then, whatever the zoom level is, the image stays at the same location. Since this approach does not require us to worry about the tiles, the implementation becomes simpler and there is no need for storing chunks of images for each zoom level and each tile. The only problem with this approach is that the loading of the image is slow since Google Maps tries to load the whole image.

Considering its advantages, adding a custom overlay example is used for this project.

5. Transition between Jacopo de’ Barbari’s map and current map

An important phase of the project is to decide on how to make a transition between the Barbari’s map and the original map. As mentioned earlier, 14 point of interest locations were identified on Barbari’s map. This means that we can easily find center coordinates for the 14 of the point of interest locations on both Barbari’s map and original map. Based on those center coordinates (call reference points) and given a chosen point (call linking point), the following transition method between the two maps is proposed.

The idea is to find out the coordinate of the corresponding linking point on the map we want to switch to. To achieve this task, we first calculate the distance between the linking point and reference points on the current map. Then, each corresponding reference points on the other map is translated with the calculated distance in the same direction. Then, we obtain a set of points. Here one idea would be to find the center of those points. However, this wouldn’t give a good result since for the reference points that are far away from our linking point should not have much effect compared to the ones that are close. In order to reduce the effect of the points that are far away, center of mass is calculated by assigning small weights for the reference points that are far away and large weights for the reference points that are close. This weighting strategy is determined experimentally. Once we have the corresponding linking point on the map we want to switch to, we can show the corresponding map by just overlapping the two linking points.

6. Results

The project was successfully completed with the following features:

– Jacopo de’ Barbari’s map is added as a top layer image on top of the original Google’s map.

– The user can see the point of interest locations (14 of them) on the Barbari’s map with aerial shades on top of those places. When the user clicks on those aerial shades, the same pop-up window with same information in the existing project is shown.

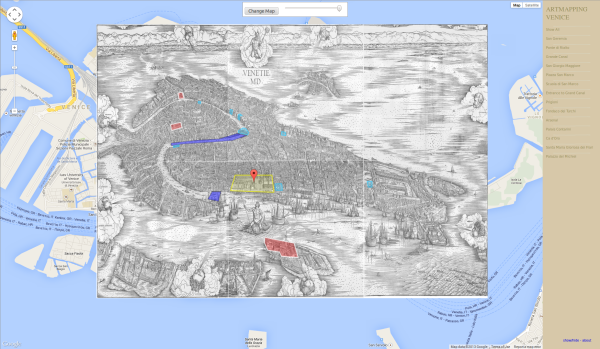
– The user can switch between the original map and the Barbari’s map given a reference point by simply clicking the “Change Map” button. The location of the reference point can be changed so that it is possible to see how the transition is affected by the location of the reference point.

– The user can change the transparency of the Barbari’s map by using the slider on the web interface.

Screenshot from 2013-12-23 15:15:27

Art Mapping Venice Web Tool with Jacopo de’ Barbari’s Map Added

All in all, the desired functionality were added to the existing project without changing the overall design much. With the help of added functionality, it is now possible to compare the current map of Venice and map of Venice 500 years ago. The user can see how the city of Venice changed over 500 years. Moreover, the user can also see the effect of having a panoramic map rather than having top view map. Barbari’s map is a panoramic view map. That is why the places that are at the south are drawn bigger compared to the places that are at the north. This difference actually makes it difficult to match the two maps.

7. References

[1] Jacopo de’ Barbari. Web. http://en.wikipedia.org/wiki/Jacopo_de%27_Barbari Date of access: 23 Dec 2013

[2] The Journey of ArtMapping Venice. Web. https://artmappingvenice.wordpress.com/2013/05/11/the-journey-of-artmapping-venice/ Date of access: 23 Dec 2013

[3] Fondaco dei Turchi. Web. http://en.wikipedia.org/wiki/Fondaco_dei_Turchi Date of access: 23 Dec 2013

[4] Villa Foscari. Web. http://en.wikipedia.org/wiki/Villa_Foscari Date of access: 23 Dec 2013

[5] Santa Maria della Salute. Web. http://en.wikipedia.org/wiki/Santa_Maria_della_Salute Date of access: 23 Dec 2013

[6] La Fenice Theatre. Web. http://en.wikipedia.org/wiki/La_Fenice Date of access: 23 Dec 2013

[7] Église du Rédempteur de Venise. Web. http://fr.wikipedia.org/wiki/%C3%89glise_du_R%C3%A9dempteur_de_Venise Date of access: 23 Dec 2013

[8] Google Maps JavaScript API v3 Documentation. Web. https://developers.google.com/maps/documentation/javascript/basics?hl=tr Date of access: 23 Dec 2013

[9] Google Maps Adding a Custom Overlay. Web. https://developers.google.com/maps/documentation/javascript/examples/overlay-simple Date of access: 23 Dec 2013

[10] Google Maps Image Map Types. Web. https://developers.google.com/maps/documentation/javascript/maptypes#ImageMapTypes Date of access: 23 Dec 2013

The Journey of ArtMapping Venice

1. Introduction

The coming of the Digital Era has brought irreversible changes in everyday life, introducing habits and methods that one couldn’t have imagined thirty years ago. One of the major changes is without any doubts the availability of the Internet almost everywhere, which brings the ability to access almost any kind of information anytime.

One of the results of this digital revolution related to our project is the printed maps on paper giving their way to extensible online digital maps and navigators. For this reason, in the last years we have seen an increasing development in what are called Geographic Information Systems (GISs), tools designed to capture, store, manipulate, analyze, manage, and present various types of geographical data. The potentials of GIS’s are enormous: the concept of map evolves by the integration of different types of information giving multi-dimensionality that pushes the limits of what can be done on a printed paper map. If the supplementary dimension added to the map is the time and the main represented data are the artworks, the process starts to become interesting by itself.

2. ArtMapping

Our first research question constituting the basis for the development of the project is represented by the definition of the term ArtMapping. Our idea stems from the desire to revolutionize the conventional approach for the discovery of a city, enriching this experience by exploiting the possibilities offered by digital maps. The means of doing this is to merge the details offered by an art catalogue with the spatial information included in a map, in order to associate the artworks depicting a particular subject in the city with the corresponding location today. Starting from these consideration, what we define with the word ArtMap is a tool which provides both the information of a map and those contained in an art book and visualize them together in a user friendly interface.

The city that has drawn our attention more than the others for ArtMapping is Venice. Playing a central role in Renaissance and being one of the essential destinations of Grand Tour, a 17th century tourism boom within aristocratic Englishmen, Venice has extensively been the subject of artists. Due to these two factors, it is relatively frequent that one finds the veduta, highly detailed painting of a city scene, of sceneries of Venice by different artists done in various periods. In this context it is especially important to remark the painters Canaletto (1697-1768) and Michele Marieschi (1710-1743), who are among the most famous vedutisti, veduta painters, of their periods.

In order to design and realize the ArtMap of Venice, we needed to define and choose the necessary ingredients. These elements fundamentally consist of:

  • The works of art: which subcategory among the several possibilities, such as prints, paintings, photos, drawings, etc., will constitute the collection that is integrated in the ArtMap.
  • The GIS: which platform is used to show the geographical information associated with each location and its related artworks.

3. Collection of artworks: Merveilleuse Venise

As the source of the artworks of Venice, we decided to focus on a particular book, “Merveilleuse Venise” by Sophie Monneret, published in 1971. The book contains prints of Venice dating from 15th century to 18th century, drawn by famous vedutisti including Canaletto and Michele Marieschi, that are preserved in the collections of Bibliothèque Nationale de Paris and Musées Civiques d’Art et d’Histoire de Venise. The drawings that are found in the book are of various types including city plans, vedute, depiction of public events and daily life in Venice. This variety of nature of drawings is especially suitable for our project, since it allows us to capture the history of Venice more thoroughly. Furthermore, the drawings are accompanied by explanatory text relating the drawing to history, which is again a big plus for conveying the story of Venice.

Ponte di Rialto, being built in 1591 it still stands as one of the most frequently used bridge of Venice.

Ponte di Rialto, built in 1591, still stands as one of the most frequently used bridge of Venice.

Mapping the prints from one single book is beneficial for our work, allowing us to collect data in a systematic way and making use of a reliable source of information, which is very important for achieving a reliable temporal resolution of Venice in the ArtMap. 

3. The geographical interface

The next decision we needed to make in order to realize our project, after defining the source of the artworks, was choosing the appropriate geographical interface that is able to relate the point of interests in Venice with the historical prints. There were a number of options to choose from for this interface, three major ones being Google Maps [4], Google Earth and ArcGIS where each one had their pros and cons.

After testing out the capabilities and usability of different interfaces, we have chosen the Google Maps interface over the others since it meets the needs of our project while being easy to use in the end users side, not needing any plug-ins to be installed. Furthermore, with this interface the user has the ability to view the city as a map or as registered satellite images. While map view gives an easy to grasp and clean representation of the city, thus accentuating the information in the prints, the satellite view gives detailed scenery information enabling the user to immerse themselves more in Venice. Furthermore, by having automatic support for aerial close-up images and changing the point of view, Google Maps interface enables the user to discover the point of interest from four different angles, giving them the ability to match the desired angle of view, in particular with the artists’.

Piazza San Marco looking north.

Piazza San Marco looking north.

Piazza San Marco looking east.

Piazza San Marco looking east, which meets the point of view of the artist more.

4. The database for point of interests and images

Since the aim of our project is to create a spatio-temporal representation of Venice, we present the user two fundamental information: geographical information of locations of Venice and their evolution with time visualized through historical prints. In order to meet these two goals, the information of locations and the prints need to be stored in a database. Two main ways this can be done are by storing the information of locations and the prints in the same database or splitting the two and relating the information between these two databases. For reasons of standardization of the geographical information used in the project and utilizing powerful representation abilities of Keyhole Markup Language (KML) without violating its standards, we decided to choose the second way and built two separate databases, one for representing geographical locations and one for the prints.

Databases

The geographical (KML) and artwork (XML) entries for Scuola di San Marco. The relation between two databases is made through the matching of id tag in KML’s description and Point of Interest (<poi>) tag in XML.

There are a number of benefits of using standard KML. First of all, KML is very powerful in terms of geocoding, having capabilities of representing complex shapes, view angles and geographical information. One of the fundamentally important benefit KML brings to our project is that it can represent polygons of different colors and styles, which enables us to confine the point of interests, buildings, piazzas, canals, etc., precisely and classify them visually according to their type by styling the polygons. Furthermore, by implementing the KML support using geoxml3 API [5] which is designed for customized interaction with placemarks in the database, the user can hide the polygons for removing the transparent overlays for better visualization of the point of interests. Next, KML is a proliferated and well supported standard for representing geographical data, which makes the completed database independent of the visualization tool. The same KML data can be imported to GIS software and the data complying with the KML standards is displayed without any special programming being necessary. Furthermore, using a known standard for representing information creates the possibility for other enthusiasts to make databases that can be displayed in our interface.

For storing the information on the prints of Venice we chose to use an XML file. The XML file stores the name of the print, the artist, the date of the print, description of the location, the tag of the location and the image files of the print and a contemporary photograph that approximating the point of view of the artist. The historical information about the location is queried when the user selects a location from the Google Maps interface. The gathered information from the XML file about the prints matching their location tags with the ID of the selected point of interest is then showed in a modal window [6]. With this implementation, multiple images corresponding to single location can be showed, enabling the user to see how the location evolved through time.

Fondaco dei Turchi has been undergone thorough restorations between 1860-1880 during which two towers were added.

Fondaco dei Turchi has undergone thorough restorations between 1860-1880 during which two towers were added.

5. ArtMaps features

The artmap final interface is designed in order to offer the user the primary tools needed for the artistic discovery of Venice:

  • The underlying map, with the possibility to switch from map mode to satellite or  earth mode, adapts to user preference.
  • The point of interests, that are well visible with every visualization mode on the map and on an external list, are coded with different color codes for churches, buildings, squares and cultural events allowing the user to quickly focus on the specific target.
  • The modal window, in which the historical prints are visualized side by side to the current appearance of the location [7], provides an easy interface for following the history of Venice.
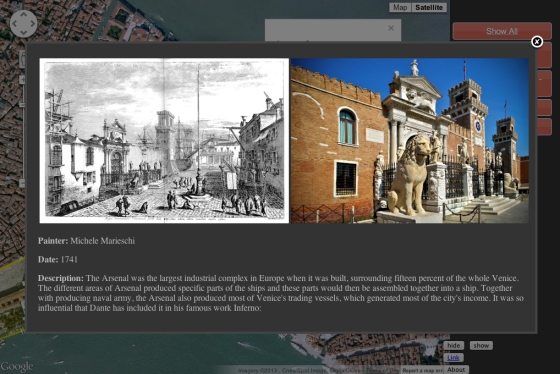
Entrance to Venetian Arsenal: Porta Magna

Entrance to Venetian Arsenal: Porta Magna

Particular importance is given on the concept of temporal resolution: when there are more than one print available for a single location, the modal window displays the prints in chronological order, with the corresponding present appearance matching the point of view of the artists’. In this way, the user is given the possibility to see and compare the different drawings, realizing the changes that the particular point of interest has undergone during the years.

Besides the visual information, a brief description is available for every location in order to summarize the related history and curiosities. Furthermore, external information such as links to related webpages or embedded videos are included for extending the presentation of the location.

An embedded YouTube video about Festa del Redentore.

An embedded YouTube video about Festa del Redentore.

6. Conclusion

We have developed a means for visualizing how Venice changed through time by using artworks. The interface is designed to be user friendly, where the historical information is visualized on a digital map. As the user requests information about a location, they are supplied with prints of Venice dating from 15th to 19th century and contemporary photographs of the same location for comparison. Furthermore, besides the visual information about the location, the user is given a description of the history and the importance of that particular place in the history of Venice. With this property, the tool is also suitable for touristic visitors of Venice for gathering visual and historical knowledge about the city and its important landmarks.

Although the designed website tells the story of Venice captured by the book “Merveilleuse Venise”, it is easily extensible since the geographical information is represented in widely accepted standard KML and the image database represented in XML follows simple tagging rules. By extending only these two files, the tool can be used for visualizing other cities or other landmarks retreived from different sources.

To conclude our project, we think ArtMapping is a user friendly concept for telling the history and helping the discovery of a city by using the artwork of famous artists of the past and visualizing them through the modern mapping tools of the present.

References:

[1] Venetian School. Web. http://en.wikipedia.org/wiki/Venetian_School_(art) Date of access: 14 May 2013

[2] Venice Art History. Web. http://www.aboutvenice.org/art-history-of-venice.html Date of access: 14 May 2013

[3] GIS. Web. http://en.wikipedia.org/wiki/Geographic_information_system Date of access: 14 May 2013

[4] Google Maps JavaScript API v3. Web. https://developers.google.com/maps/documentation/javascript/ Date of access: 14 May 2013

[5] Geoxml3. Web. https://code.google.com/p/geoxml3/ Date of access: 15 May 2013

[6] SimpleModal. Web. http://www.ericmmartin.com/projects/simplemodal/ Date of access: 14 May 2013

[7] Panoramio. Web. http://www.panoramio.com Date of access: 14 May 2013